
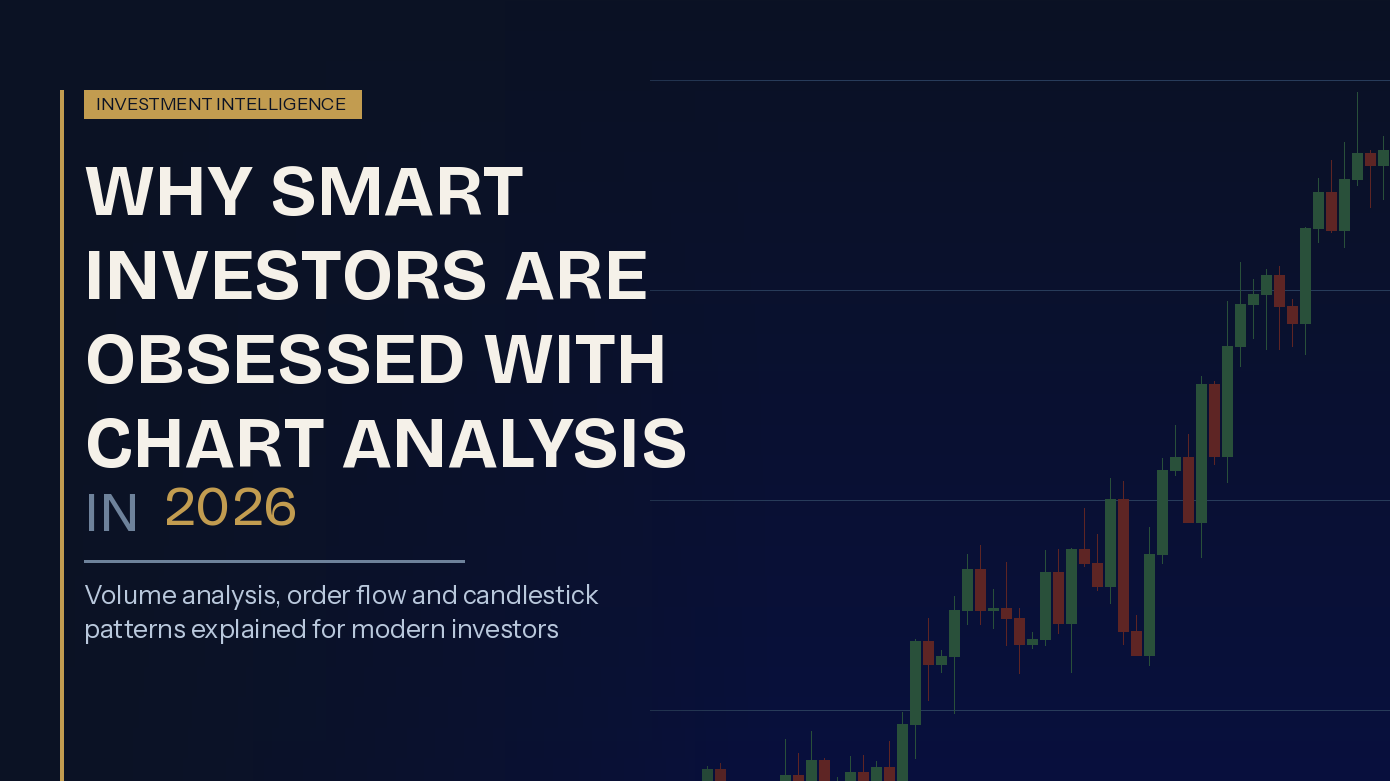
A shift is happening in how serious investors approach the markets — a steady migration toward data-driven decision-making. And at the center of it sits chart analysis: a discipline that was once considered the exclusive domain of floor traders and hedge fund analysts, but that retail investors now use with real sophistication.
So why are more and more investors spending time on charts in 2026? The short answer is that the tools got better, the data got more accessible, and the cost of ignoring price action became impossible to overlook.
Advanced chart analysis adds layers of information — volume profile, delta analysis, order flow data — that help you see why the price moved, not just that it moved. That distinction makes a significant difference when you’re deciding whether to enter a trade or hold back.
What “Advanced Chart Analysis” Actually Means in Practice
The word “advanced” gets thrown around a lot, so it’s worth being specific. In the context of modern chart analysis, it usually refers to a few interconnected concepts.
- Candlestick analysis is actually a good starting point, because it’s something most traders already know in a basic sense. But in 2026, candlestick analysis has gone much deeper than “this is a hammer pattern, price might reverse.” Sophisticated traders now look inside each candle using footprint charts, which show exactly how volume was distributed at every price level within a single bar. Though, of course, many still value candlesticks for their visualization benefits.
- Volume profile is another major piece. Instead of looking at volume as a bar at the bottom of a chart, volume profile distributes it horizontally — showing you which price levels saw the most trading activity over a given period. The point of control (POC), the value area high and low, and low-volume nodes all become visible. Price tends to gravitate toward high-volume areas and move quickly through low-volume ones. Traders who understand this can set more logical entries and exits.
- Order flow is a more advanced technique that involves watching how buy and sell orders actually flow through the market in real time. This is the closest thing retail traders have ever had to seeing what institutional participants are doing.
Technical Chart Patterns in a Volume Context
Most traders learn technical chart patterns — head and shoulders, double tops, flags, wedges — fairly early. These patterns represent recurring dynamics in how participants behave. But a pattern without volume context is a hypothesis, not a high-probability trade.
Take a simple breakout from a consolidation zone. In a traditional analysis approach, a close above resistance signals an entry. That approach still catches good trades, but false breakouts are common, and they tend to punish traders who rely on price alone.
When you add volume analysis, the picture gets clearer:
- A breakout accompanied by a strong buying delta (more aggressive buyers than sellers) is more credible than one driven by low volume.
- If the breakout level coincides with a high-volume node in the volume profile, it’s likely to hold — the market spent a lot of time there for a reason.
- If price moves quickly through a low-volume zone above resistance, it can travel further and faster than most traders expect.

The Tools That Made This Possible
None of this would be practical without the right software. And this is honestly where 2026 looks different from even five years ago.
Platforms that specialize in stock chart indicators, order flow, and volume analysis have become significantly more accessible. One example is ATAS — a charting platform built specifically for this kind of analysis. It provides footprint charts, volume profile tools, depth of market (DOM) visualization, and order flow indicators in one place. What used to require institutional-grade infrastructure and expensive data feeds is now available to independent traders.
The broader point is that the technology gap between professional and retail analysis has narrowed. Institutional traders still have advantages — capital, speed, relationships — but in terms of what you can see on a chart, retail traders now have access to much of the same data.
Why Investors (Not Just Traders) Care About This
Chart analysis has traditionally been associated with short-term trading. Fundamental investors sometimes treat technical analysis with suspicion, but that attitude has softened, for good reason.
Even long-term investors benefit from understanding chart structure. If you’re buying a stock because the fundamentals are strong, it still makes sense to buy at a technically favorable level. Timing a purchase near a high-volume support zone or waiting for a pullback that confirms buyers are stepping back in can meaningfully improve your average cost basis over multiple positions.
There’s also a risk management angle. Investors who understand price structure can set more logical stop levels based on where the market logic would actually break down. A stop placed below a major volume node has a structural basis; stops placed 5% below the entry regardless of other conditions are just guesses.
To Conclude
In 2026, the accessibility of charting tools means the bar for “good enough” analysis has risen. Basic indicator setups that worked in less competitive markets or were often recommended in strategies for beginners are getting picked apart. The investors who are serious about performance put effort into genuinely understanding market structure — not just memorizing patterns, but building a real framework for why price does what it does.